
SUNNYDAY TECHNOLOGIES / TECHNICAL PAPER
Version 0.2 · Preprint · Self-published · Not peer reviewed
Convergence Engineering for AI assisted CAD
Nick Sonnentag · Sunnyday Technologies, Wisconsin,
USA
ORCID 0009-0002-1897-384X · nick@sunn3d.com
Original publication: 16 April 2026 ·
Revision: 15 September 2026
Version: 0.2 (preprint) · License: CC
BY 4.0
Keywords: AI-assisted CAD · geometric checks · failure tracking · engineering verification · M3-CRETE
Abstract
A passing CAD check leaves two questions: did the geometry improve, and did the check measure the right requirement? This paper examines retained M3-CRETE development records and proposes a practical method for answering them.
Four of the original six session archives were available in the inspected publication archive. Two contain 18 execution-linked numerical results. They document check corrections and a placement repair, with changing check totals. Later committed work removes generated mounts in favor of authored parts and places brackets from observed motor positions. These records do not establish declining discovery of new failure classes or a time to reliable operation.
The proposed method preserves each attempt, separates design repairs from check corrections, and records what each result covers. Decisions to widen use should consider recurrence, severity, workload and coverage. The contribution is an engineering experience report and measurement plan. General reliability improvement and physical performance remain untested.
Graphical abstract
What this revision changes
The original paper combined failed checks and failed runs in a figure labelled as new failure classes. Those quantities are different. This revision replaces that figure with the observations the retained records support. It also withdraws the claimed two-to-three-day convergence result and the automated catch percentage. The deposited v1.0 remains the historical source [1]; its DOI does not identify this revision. This revision uses the author-selected preprint numbering, version 0.2; the earlier deposit retains its original version label.
1 Start with the part in front of you
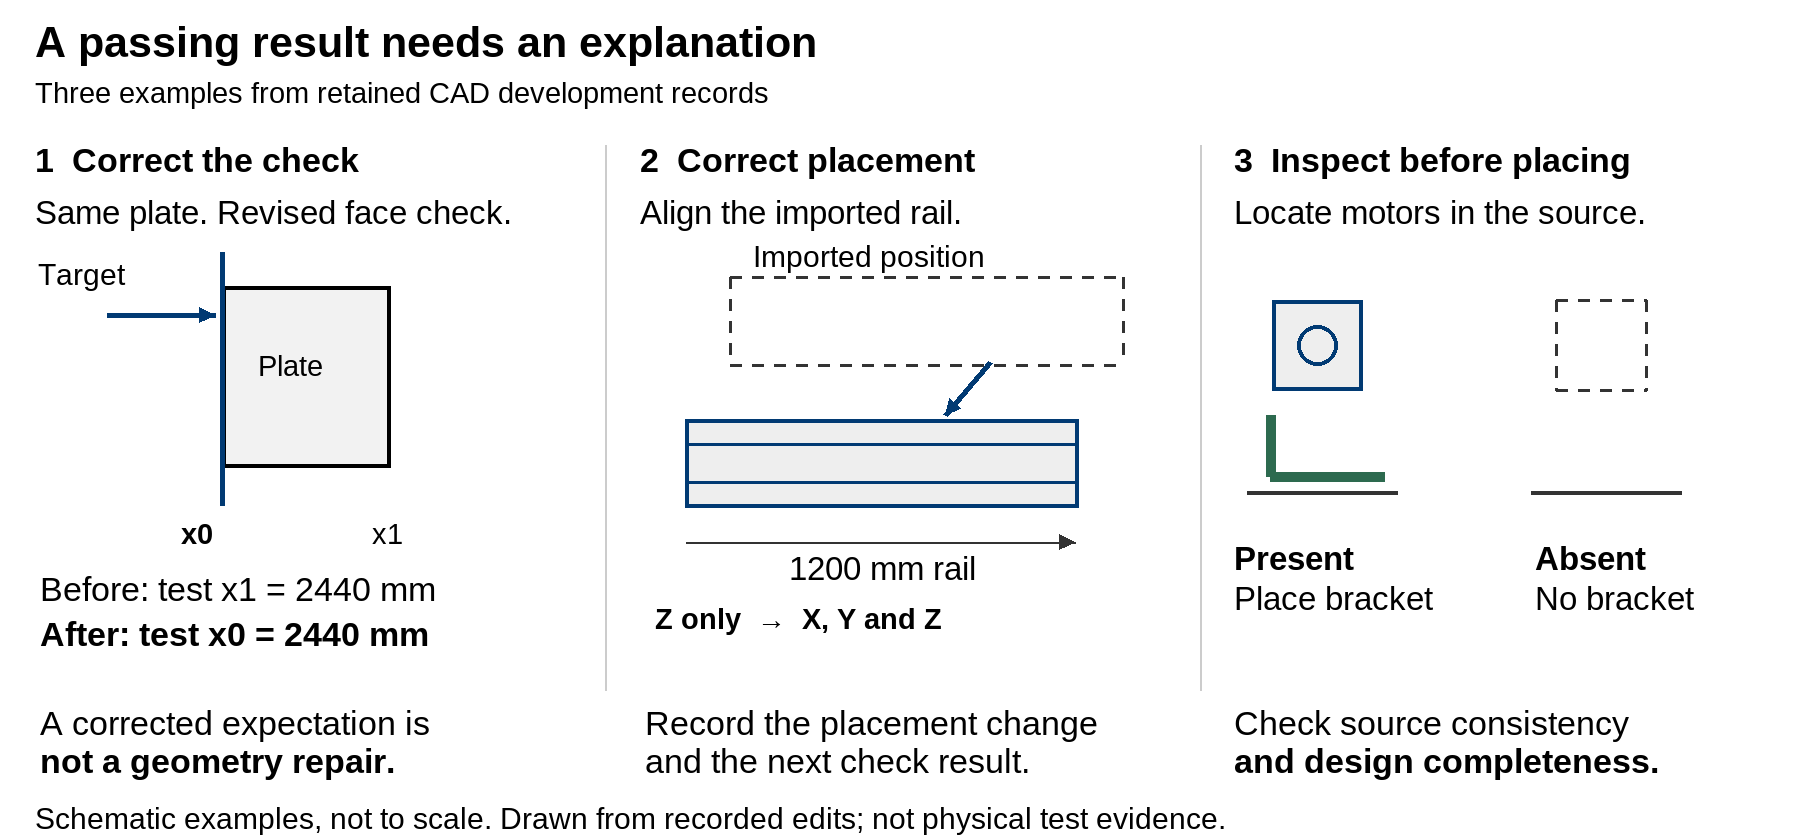
A bracket can be placed at the expected corner of a frame even when the motor it should support is absent from the source assembly. The coordinates may be internally consistent. The assembly can still be wrong for the source in use.
Later M3-CRETE development records show a direct response to that problem. An April 26 change replaced a list of fixed bracket targets with placement derived from motor positions found in the imported geometry. It also tightened the rule that distinguished a Y-axis motor from an X-axis motor. The expected bracket count changed with the source inventory [3].
This is a useful place to begin because it makes the engineering question concrete. A successful export tells us that a file was produced. A count check tells us whether the observed inventory matches an expectation. Neither, by itself, tells us whether the assembly satisfies the design requirements.
The same issue arises when a check refers to an earlier version of a part. A red result may expose bad geometry, an outdated expectation, or both. Making the result green is only the beginning of the explanation. We also need to know what changed and why that change was justified.
I use convergence engineering here as a name for organizing this investigation. The aim is to make failures visible, preserve the evidence and turn each useful discovery into a clearer requirement or check. The name does not establish a new theory of reliability. It describes a way of managing development that needs better measurement than the original paper supplied.
The intended reader is someone using AI to help assemble or inspect CAD and deciding how much confidence to place in the output. The examples concern software checks on digital geometry. A machine built from that geometry still requires the relevant design review and physical validation.
2 What the retained records show
Evidence and counting rules
The original account described six sessions. This review located four corresponding full archives in the retained publication archive. The final two session identifiers were not recovered in the inspected locations. Their entries in the original supplementary table remain historical summaries, not independently reconstructed observations [2].
The extraction looked for numerical check summaries in tool results and linked those results to recorded commands that invoked the check scripts. This matters because reading an old report can return the words “231/231 passed” without executing a new check. One such unlinked numerical result appears in the April 13 archive. It is excluded from the execution series.
Three quantities need separate names. A failed check is an assertion that did not pass in a particular run. A failed run is an execution that did not meet its acceptance conditions. A failure class groups occurrences that a reviewer has judged to have the same relevant cause or mechanism. Eight failed checks may arise from one changed part. One failed run may contain several unrelated problems. Neither count is automatically a count of new classes.
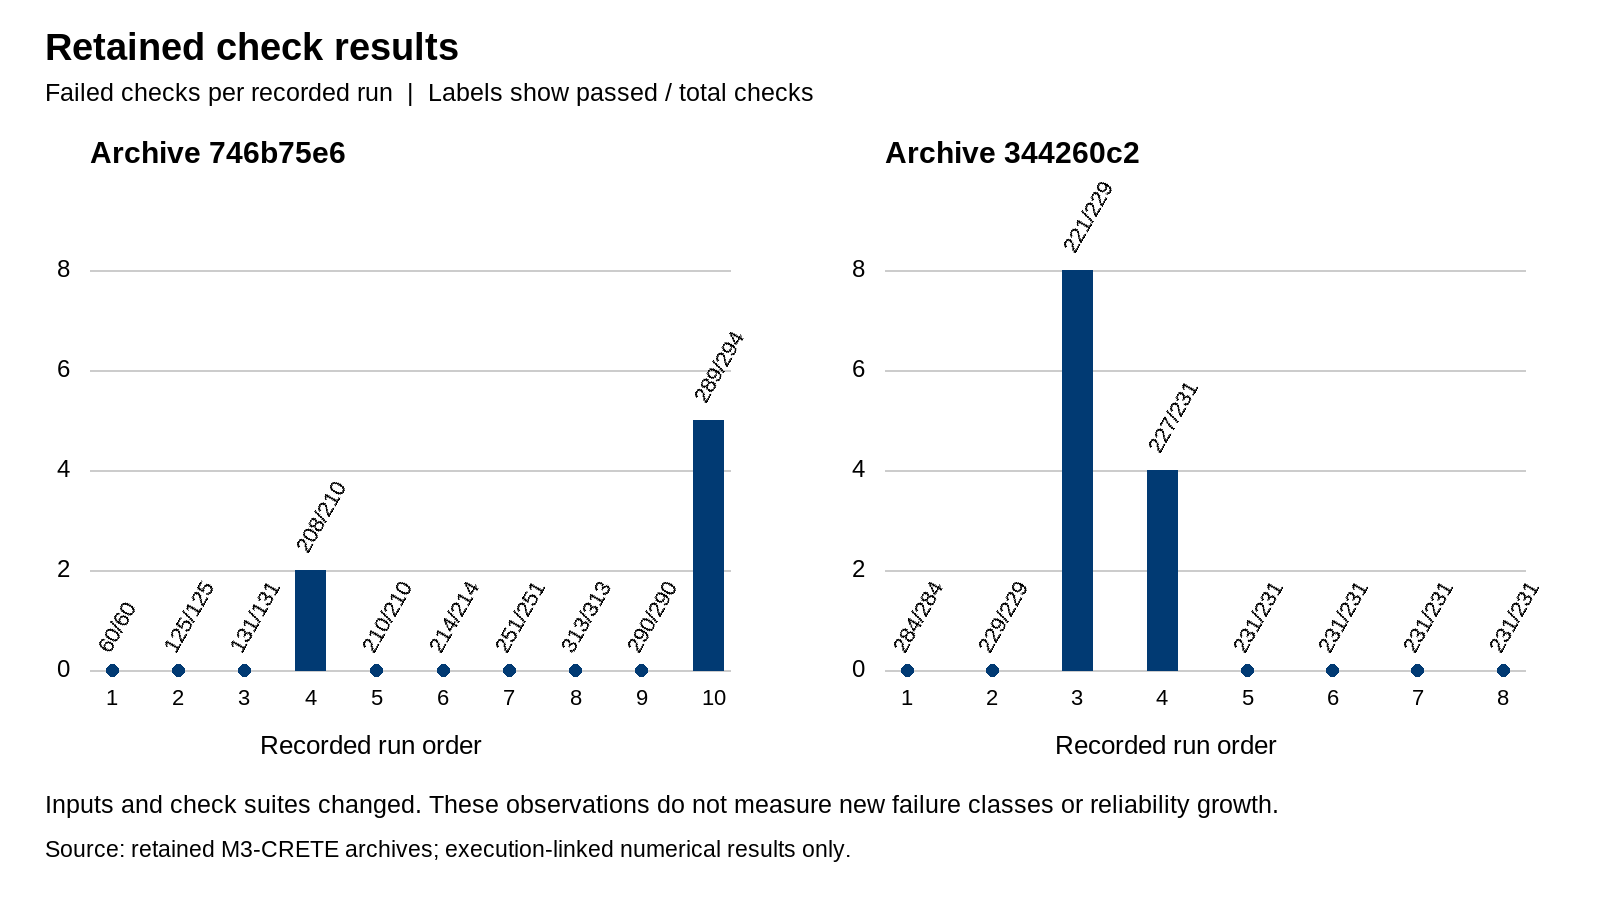
The retained summaries establish passed and total checks for 18 linked results. They do not provide a reviewed class register with stable identifiers. The revised figure therefore reports failed checks within each result. It does not estimate a discovery rate.
Coverage of the original sessions
| Archive identifier | Linked numerical results | What can be said |
|---|---|---|
| 746b75e6 | 10 | Suite totals vary from 60 to 313. The last linked result is 289/294. |
| 344260c2 | 8 | Suite totals vary from 229 to 284. An intermediate sequence is 221/229, 227/231, 231/231. |
| 698d76b7 | 0 | No matching executed result was recovered. This is not a clean test run. |
| 27d97cdf | 0 | A numerical report was read, but was not linked to a new check execution. |
| bd4a112a and 3fd7d82e | Not reconstructed | The original summary is available; corresponding full archives were not recovered in the inspected scope. |
The archive filenames are labels, not precise event dates. For example, linked results in the file labelled April 12 begin on April 11 UTC. The evidence CSV retains the result timestamps and line numbers so the sequence can be checked without relying on a filename.
A check correction
In archive 746b75e6, a recorded result reports 208 of 210 checks passing. The intervening edit changes the expected face of a right-side plate from its positive-X face to its negative-X face at the same coordinate. The next recorded result is 210 of 210 [2, lines 485–491].
That sequence is evidence of a check correction followed by a passing return. It is not evidence that the geometry was repaired between those two results. Whether the revised face expectation is the right design requirement still needs its own justification.
This distinction should survive in a failure register. If the event is recorded only as “two failures fixed,” a later reviewer cannot tell whether the assembly improved or the description of acceptable geometry changed.
A changed requirement followed by a placement correction
Archive 344260c2 contains a more informative sequence. A result reports 221 of 229 checks passing. The next relevant check edit replaces expectations for a 1190 mm rail with expectations for a 1200 mm C-beam and adds a height-position check for each side. The next result is 227 of 231 [2, lines 371–384].
The following assembly edit changes how the imported rail is translated. It previously corrected only its Z position. The edit also moves its X and Y center to the intended coordinates. The next result reports 231 of 231 [2, lines 389–392].
There are two developments here: the checks were brought into line with the intended part, and the assembly placement logic was then changed. The records support that sequence. They do not show that eight independent failure classes were discovered and eliminated, and they do not isolate the effect of AI assistance from the surrounding human decisions.
Why this is not a convergence curve
The first archive contains several all-pass results before a later 289/294 result. The suite grows, shrinks and changes as the work proceeds. Its last recovered numerical return is failing, even though further edits follow. A later passing return was not recovered in this extraction.
A plot of selected green endpoints would hide that information. So would using a quiet writing session as a zero-failure engineering exposure. The two panels preserve the sequence and changing denominators. There is no fitted decay line, weekly threshold or inferred time to silence.
Even a consistent downward trend would need interpretation. Fewer failures can reflect a better implementation, easier work, fewer checks, suppressed reports or a different definition of a class. This sample cannot separate those explanations well enough to estimate reliability growth.
3 What later CADCLAW work adds
The retained development history is useful because it records changes in the approach to the CAD problem, including changes that limit what the software should attempt.
An April 26 M3-CRETE commit removes generated mount geometry and switches the source STEP file. The commit explains that the generated hole positions did not align with the authored assembly. The inspected code change removes the generators and relies on authored input instead [3]. CADCLAW’s retained project guidance subsequently describes its role as assembling and checking authored parts, with part design performed in native CAD [4].
This supports a practical boundary: obtain the part geometry from an appropriate design process, then use automation to place and inspect it within a stated scope. It does not show that every generated part is unsuitable or that authored parts are automatically correct.
A second April 26 change moves bracket placement from fixed corner targets to the positions of motors actually found in the input. The code distinguishes high Z-motor positions from lower motors near the frame edges, then places brackets relative to those observations. It also changes the expected bracket count from six to five [3].
The placement change is concrete support for probe before placing: inspect the relevant source geometry before deciding where dependent parts belong. Yet the count change raises another question. If a required motor is missing, producing no bracket may correctly represent the current source while leaving the design incomplete. A source-consistency check and a design-completeness check should be separate.
The commit message reports a passing self-check while also noting a remaining motor-plate alignment issue. This revision treats that as a developer report, not as a newly reproduced execution. It is another reason to state what a check covers before presenting its status as assurance.
These later records strengthen the experience report. They show architectural restraint and more direct use of source geometry. They do not retrospectively validate the earlier curve, establish physical assembly performance or supply a controlled comparison of methods.
4 A practical method for the next assembly
Define the task and the acceptance boundary
Before the attempt, describe the assembly, the source parts and the intended use of the output. Separate source consistency from design requirements. Identify which requirements can be checked numerically and which need a competent person to inspect the geometry or design.
For a bracket, the acceptance record might name the source part, the motor it serves, the expected mounting faces, the permitted clearance and the check that measures it. A part count alone is insufficient. Where a requirement has not been specified, record the uncertainty rather than inventing a tolerance to obtain a pass.
Record the input and check-suite versions. A result without those references is difficult to compare with the next attempt. Use hashes or immutable revision identifiers where available, and retain the approved exceptions alongside the suite.
Preserve the attempt before changing it
Keep the input, output, relevant commands and actual check results. Record unsuccessful attempts as well as successful ones. An export failure, an interrupted execution and a completed run with failed assertions are different outcomes.
Do not overwrite a failed artifact with its repair. The earlier state is what allows someone to determine whether the new check would have caught the problem. Sensitive session material can remain private; a small, carefully extracted result record is often enough for an internal review.
Investigate what the result means
A failed check is a lead. Inspect the geometry and requirement before classifying it. Ask whether the problem lies in the source part, placement, measurement code, expected value or execution environment. If the cause is unresolved, leave it unresolved in the register.
Separate occurrences from classes. Repeated instances of a known placement error should remain visible even when they add no new class. If later investigation splits one provisional class into two, retain the mapping and the reason. Otherwise, a change in classification can look like a change in performance.
Human review belongs in this step. The reviewer can identify requirements the harness does not yet express, but the present records do not support a percentage for how much the human or automated checks contributed.
Repair the appropriate thing
The appropriate response may be a geometry change, a corrected check, a clearer requirement or a narrower scope for the tool. Record which one occurred. When a check changes, explain why the new expectation follows from the design rather than merely matching the current output.
An intentional contact exception should name the specific relationship and its reason. Broad exclusions deserve scrutiny because they can also hide unintended overlap. A permitted shaft-through-mount relationship does not justify ignoring every collision involving a motor.
Retries can be useful when an operation fails transiently and retrying does not corrupt the work. A fallback can also be useful when its reduced scope is explicit. Stop when the output would conceal an unmet requirement or continue from an invalid state. This decision depends on the failure and intended use; there is no universal rule that every fallback is wrong.
Repeat with a clear comparison
Run the repaired case again and retain the new result. Where practical, also run the new check against the preserved failing artifact. That helps distinguish a check that detects the original issue from one that merely passes the latest file.
Use a stable set of cases for comparisons, then add challenging or unfamiliar cases separately. When the input or suite changes, mark the boundary. The additional cases are valuable, but their results should not be folded into an unchanged denominator.
Decide whether to widen use
Review unresolved problems, recurrence, severity and coverage before permitting broader use. State the decision and the remaining restrictions. A quiet interval can be supporting evidence only when it includes relevant work and functioning checks.
This paper proposes no universal number of runs or days. The required evidence depends on the consequences of failure and the intended operating conditions. A digital placement aid and a machine design released for fabrication require different assurance. Software checks do not replace the responsible design review or physical validation.
5 Measure progress without losing the failures
Keep the denominators visible
For each run, report the number of checks attempted, passed, failed and skipped, with reasons for skips. Record whether the run completed and what workload it exercised. Report changing suite sizes directly.
A new-class discovery rate requires reviewed class identities and an exposure measure. The exposure might be comparable assembly attempts or a defined amount of operation, depending on the task. If calendar time is reported, also show how much relevant activity occurred during that time. Two days spent editing prose are not two days of CAD testing.
Alongside discoveries, report recurring occurrences and unresolved severe problems. A system can produce no new class while repeatedly failing in the same serious way. Novelty is useful for directing investigation, but it is not a definition of reliability.
Track unresolved work correctly
The number of newly discovered classes minus the number resolved during a day is a change in the backlog. To obtain the backlog, begin with the unresolved total at the start of the period, add newly opened and reopened classes, and subtract classes closed under the recorded closure rule.
Class merges, splits and reclassifications need explicit adjustments. Accepted exceptions should remain separately visible rather than disappearing as successful repairs. This is accounting for engineering work; it is not a reliability estimate.
Make the decision rule prospective
Specify the observation window, workload, severity policy and required coverage before using them for an acceptance decision. Define how a changed suite affects comparability. Record who can approve an exception and what triggers a review.
For the next study, useful questions include whether a repaired fault recurs on held-out assemblies, whether the checks detect deliberately retained known faults, and how often human review identifies a material issue after a passing result. Those outcomes can test the proposed practice more directly than a count of quiet sessions.
No such prospective study is claimed here. The current evidence is retrospective and drawn from one evolving project.
6 How this fits existing engineering practice
Failure tracking and reliability growth already have a substantial engineering history. NASA’s software reliability guidance discusses defect tracking and modelling, and its research on this topic connects data collection with the assumptions needed for analysis [5]. This paper does not replace that work. Its retained data are too limited and inconsistent for a growth-model fit.
The proposed practice also shares the fail-fast principle of exposing a problem near its source, where it can be investigated [6]. In CAD, that may mean rejecting an unsupported part classification before dependent geometry is placed. Early visibility is useful only if the reported failure is meaningful and the response preserves the evidence.
Site reliability engineering offers a related discipline for defining what acceptable operation means. A service-level indicator is a specified measure; an objective sets its target and window. An error budget is tied to those definitions, not to every defect or exception reported anywhere in a system [7]. For this CAD case, the first task is to define an appropriate outcome measure rather than import a service uptime target.
Chaos engineering asks practitioners to state expectations and examine system behaviour under controlled disturbance [8]. The comparable idea here is to challenge the checks with known or deliberately introduced faults in isolated test copies. That is a proposed next step, not an experiment performed in the present record.
The distinctive content of this paper is therefore the CAD experience: check corrections can look like geometry repairs, source inventory can be mistaken for design completeness, and retained development records can reveal those differences. The broader principles are shared with established testing and engineering practice.
7 Limits and the next study
This is a retrospective review of selected retained material from one development effort. Four of six original archives were available in the inspected publication archive. Only two supplied linked numerical executions. The extractor recognises particular output formats; other valid results may exist in forms it does not recognise. There was no new execution or independent geometry regrading during this review.
Inputs, checks and scope changed during the recorded work. The available records do not support a stable failure-class series, an automated detection percentage, a causal speed comparison or a commissioning-time estimate. Commit messages provide useful context but are weaker evidence of execution than a preserved command and result.
The next study should preserve a fixed comparison set and an independent set of unfamiliar assemblies. It should identify the suite version, workload and intervention for each run; distinguish defects from measurement corrections; and retain the failing artifact for review. Changes to the workload, model, tools or human assistance should be recorded rather than hidden inside one time series.
A reviewer should then examine selected class assignments and closure decisions. Detection tests should include known faults, while completeness checks should examine requirements that cannot be inferred from the existing source inventory. Physical claims would need a separate physical test programme appropriate to those claims.
Until that work exists, this method is a proposed way to improve the visibility and review of failures. Its effectiveness across projects remains an open question.
8 Conclusion
The retained records are worth reading because they show the detail that a simple pass count misses. One green return followed a corrected face expectation. Another followed updated rail checks and a placement change. Later development reduced generated geometry and placed brackets from observed motor positions.
Those examples support a practical habit: preserve the failure and explain the change before relying on the next passing result. They do not establish that new failures approach zero at a predictable rate.
The useful outcome is a more reviewable engineering process. Each result should tell the next reader what was checked, against which requirement, with which limitations, and what remains to be done.
Data availability and assistance
The original self-published working paper is deposited at Zenodo [1]. The accompanying revision package includes the extraction script, numerical observations, archive hashes, evidence ledger and correction plan. Private raw transcripts are not included. Later repository changes are identified by full commit IDs in the ledger. Public access to every underlying artifact is not claimed.
This revision was prepared with AI assistance for source inspection, evidence extraction, organization and drafting. The author reviewed and approved this revision for release on 15 September 2026. No physical tests or new benchmark runs were performed for this revision.
References
- Sonnentag, N. Convergence Engineering, deposited v1.0 working paper, 2026. Historical source, not the present revision. https://doi.org/10.5281/zenodo.19863081
- M3-CRETE retained session archives and original supplementary
convergence data. Local source collection, April 2026. Archive hashes,
line locators and scope in the accompanying Evidence Ledger;
extracted results in
evidence/numeric_observations.csv. - M3-CRETE development history, 26 April 2026. Commits
09fc3e1eb8285654359644ee4ed4a7bec53c9e08andf914325821589d6a337c760b1b9f5e42bdfcb352. Inspected implementation changes; full source paths and evidence classifications in the ledger. - CADCLAW project guidance,
AGENTS.md, retained checkout inspected 15 September 2026. Scope statement and retrospective April 26 account; not a physical test report. - NASA. SARP Toward a Guide for Software Defect Tracking Modeling and Analysis, 21 May 2020. https://sma.nasa.gov/news/articles/newsitem/2020/05/21/sarp-toward-a-guide-for-software-defect-tracking-modeling-and-analysis; Software Engineering Handbook, Software Reliability. https://swehb.nasa.gov/spaces/SWEHBVC/pages/71041237/8.02+-+Software+Reliability
- Shore, J. Fail Fast, 2004. https://www.jamesshore.com/v2/blog/2004/fail-fast
- Jones, C., Wilkes, J., Murphy, N., and Smith, C. Service Level Objectives. Google, Site Reliability Engineering. https://sre.google/sre-book/service-level-objectives/
- Principles of Chaos Engineering. https://principlesofchaos.org/
Appendix A Proposed record structure
This is a data contract for a future implementation. It is not a description of a deployed database.
Run. A unique run ID identifies the input hash, implementation revision, check-suite revision, conditions, start and end times, completion state, workload and result artifact. Repeated attempts receive new IDs even when the input is unchanged.
Occurrence. Each observed issue has an occurrence ID, run ID, check or reviewer reference, affected object, evidence locator and severity. An import key prevents the same retained observation being imported twice. Separate runs can legitimately contain repeated occurrences of one class.
Class. A class ID identifies the reviewed failure mechanism within a stated project scope. A candidate fingerprint helps suggest matches but does not establish equivalence. Where a fingerprint is used as a unique key, enforce uniqueness on the scope and fingerprint version as well as the fingerprint. Resolve conflicting assignments explicitly; an ordinary nonunique index is not deduplication.
Review and resolution. Record who assigned the class, the supporting reasoning, the repair or check change, verification references and each status transition. Preserve reopening, merging and splitting history. Allow an occurrence to remain unclassified while it is investigated.
Exception. Record the requirement affected, the reason for acceptance, the approving role, the applicable version and the conditions for reconsideration. Report accepted exceptions separately from repaired defects.
Together, these records allow someone to reconstruct a run’s result, inspect recurring faults and explain the unresolved total without treating every red assertion as a newly discovered class.
Version history
- 15 September 2026: version 0.2, author-approved revised preprint. The preprint numbering was selected by the author; the historical edition keeps its original label.
- 16 April 2026: original version 1.0. Its quantitative convergence interpretation is superseded. Historical PDF · Original Zenodo deposit.
Zenodo has not been updated. The original DOI does not identify this revision.